Starter Platform (assisted mode)
The Starter Dashboard: Focusing on What Generates Sales 📊
Once you have launched your ad, the dashboard becomes your main control panel. The key is to ignore the "noise" and focus on the indicators that directly impact your profitability. Starter Mode presents the essential metrics to avoid information overload.
1. Vanity Metrics (The Noise) 🔇
These are the metrics that make you feel good, but do not necessarily make you money. Do not ignore them, but they should never be your main focus:
- Likes and Comments: Indicate interaction, but high interaction with low ROAS means you are paying for entertainment, not for customers.
- Impressions: How many times the ad was shown. It is a metric of volume, not quality. Directly related to Frequency.
2. Business Metrics (The COGS-First Focus) 🎯
These are the profitability metrics. COGS-First (Cost of Goods Sold First) requires that your advertising be profitable before anything else:
| Key Metric | What It Measures | Action |
|---|---|---|
| CPA (Cost Per Acquisition) | How much it costs you to acquire a new customer (the most important metric). | If too high, the campaign must be paused. |
| ROAS (Return on Ad Spend) | How many euros you earn for every euro spent on advertising. | Must be consistently above 1 to be profitable. |
| CTR (Click-Through Rate) | The proportion of people who click after seeing the ad. Measures creative quality. | A low CTR (<1%) is a sign of Creative Fatigue or poor segmentation. |
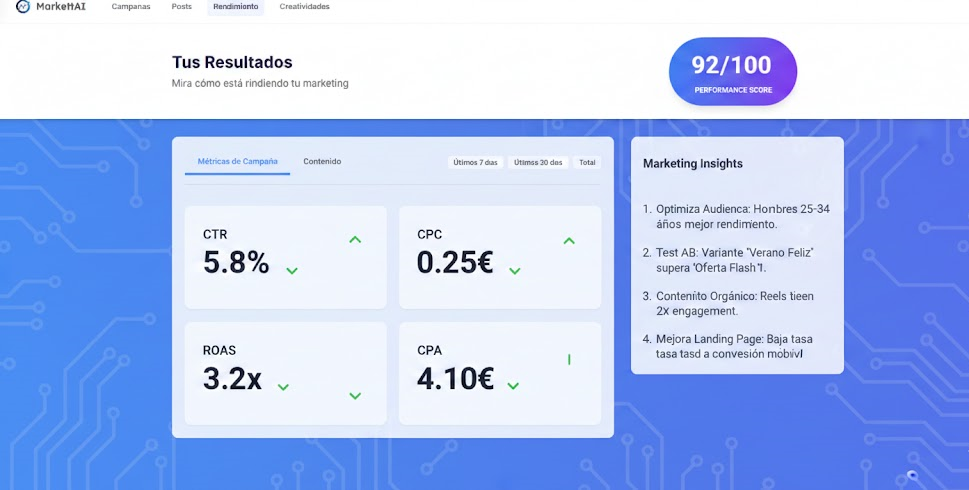
Starter Dashboard Reading Guide
The campaign view in Guided Mode is simpler, showing only the essential metrics. Markettai will always highlight CPA and ROAS in green (profitable) or red (inefficient) to guide your attention and help you execute the Next Best Action.