Application modules
Performance Section: Analysis and Diagnostics Dashboard
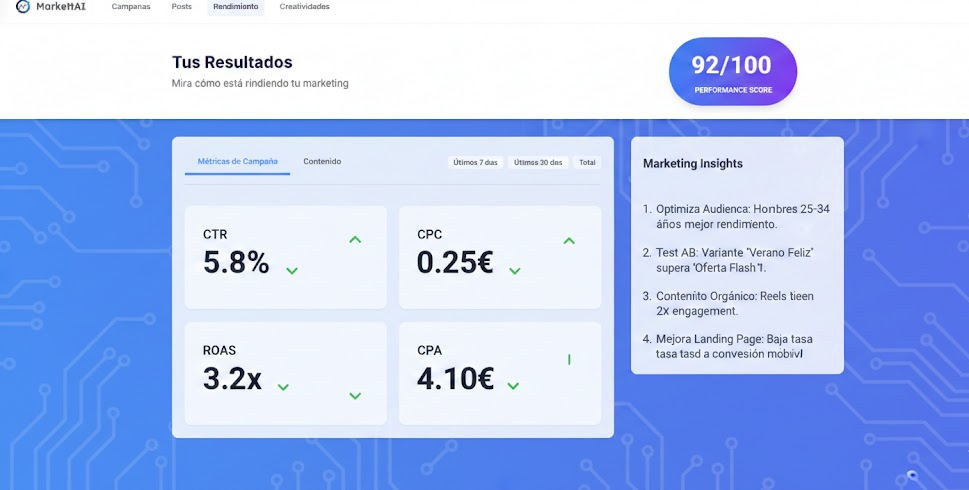
The Performance section is the central analysis dashboard. It is designed to monitor the general performance of the business (paid campaigns and organic posts) and provide actionable, AI-driven insights.
1. Knowledge Mode: Guided vs. Expert 🧠
The view structure differs primarily by the complexity of the metrics and control over the available graphs:
2. Main View Structure 🔍
2.1. Global Performance Scoring (0-10) ⭐
This is the business health metric. It is a consolidated score from 0 to 10 (with 10 being optimal) that reflects the general efficiency and profitability of all active campaigns and posts, based on the defined ROAS objective.
2.2. Performance Tabs
- Simple Metrics: Includes basic data such as Clicks, Impressions, and general Spend/Cost. It is the financial and traffic summary.
- Creatives (Creative Performance): Shows a ranking or list of the best creatives (images, videos, texts) that are generating the best return (ROAS/CPA) across the entire business. Ideal for identifying winning content.
3. Insights and Actions (The Role of the AI) 🤖
This section offers the diagnosis of the AI Engine, but its content varies according to the Usage Mode (Total Delegation or Manual):
The goal is always to provide the most relevant information so that the user or the AI can take the most profitable action at any moment.